Hello! I had about a year and a half of writer’s block, but good news! I’m back with my most interesting and intellectually challenging project yet.
Recently the Tampa Bay Lightning of the NHL became just the second team since the 97-98 Detroit Red Wings to repeat as Stanley Cup champions. The first were the 16-17 Pittsburgh Penguins. However, there was a sizable gap between the Red Wings and Penguins. I wanted to quantify the probability of each defending champ repeating each year in that time frame. I looked at all defending champs from 99-00 (98-99 would have been a threepeat, not a repeat) through 15-16 and quantified (using regular season win % in regulation and math) that these teams repeated as champs. It’s important to note I originally tried to quantify this streak of no repeat winners overall but realized that the math won’t work, so instead I quantified each team each year separately.
There are a few caveats to the data:
- As already mentioned, I looked at only the regulation wins and losses of teams in the regular season. 3 on 3 overtime, 4 on 4 overtime, and shootouts don’t exist in the playoffs so the easiest thing to do was just eliminate those games altogether.
- It’s not perfect since overtime games DO exist in the playoffs but I thought it was a good mix of efficient and effective.
- I recognize that regular season records aren’t a perfect measure. This doesn’t account for in season player trades (especially ones later in the year) and coaching changes. The 11-12 Los Angeles Kings were an 8 seed but had an active trade deadline, for example. Also, this doesn’t account for momentum if one believes in that. Finally, This doesn’t account for experience. The Chicago Blackhawks in theory had a better shot to repeat than other teams.
- I did not include the new conference setups. Until 13-14 the matchups were simple. The three division winners take the top 3 spots and 4-8 is ranked by points and if there are ties, tiebreakers are used. Starting from 13-14, there was a wildcard system incorporated that has complex matchup scenarios. For simplicity purposes I used the old method from NHL.com’s conference page where the top two seeds are division winners and every one else is ranked by points.
- This only affected the 15-16 analysis because in 13-14 the Blackhawks made the conference final and therefore seeding didn’t matter because we knew who their opponents were that were needed to win the cup. The 14-15 Los Angeles Kings didn’t even make the playoffs so their probability of winning the cup was 0%. More on these scenarios in the next bullet point.
- I don’t think it makes much difference. In addition to it being relevant only for one season’s worth of data, the new matchup setup is somewhat random and more heavily influenced by the strength of divisions.
- Since I’m looking at seasons that already ended I’m assigning any series wins a probability of 100%. For example, the 99-00 Dallas Stars won the first three rounds of the playoffs and lost in the final round (Stanley Cup final), I assigned their probability of winning the cup that year as their probability of winning just the one series, and effectively assuming that they won their first three rounds with a probability of 100%. It doesn’t make sense to assign them anything else knowing what happened.
- One way to look at it is if all 16 defending champs missed the playoffs then it wouldn’t even make sense to model out the probability of winning the cup since it would be 0%. Similarly, if all defending champs lost in the cup final it would be a little absurd to give them a probability of say 5% each of the 16 years.
- The way to look at it, what was the probability all of these teams wouldn’t have won the cup given the actual results of the series they’ve won. The only rounds that got modeled out are round that the teams lost in and all of the hypothetical rounds in the future.
I’ll now get into methodology. High level, I started by getting the win percentage of regulation games for each team (Regulation wins/(Regulation wins + Regulation losses). Then I used the below formula to calculate head to head matchups and the probability of winning one game for each team. I used home and away percentages and calculated home wins, home losses, away wins, and away losses. The formula for each individual game win is one that I’ve used before in my blog:
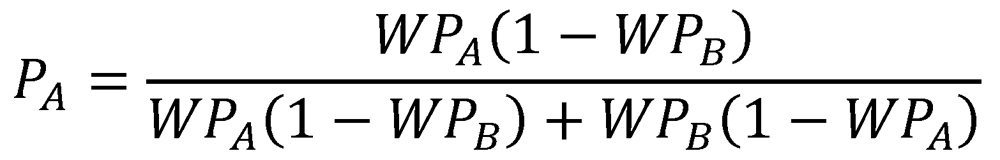
W= win
P= Probability
A = Team A
B = Team B
Below is the source that I used:
After getting the probabilities for home/away wins/losses, I used probability and combinatorics to model out out the probability that a given team wins in 4, 5, 6, and 7. The first step in calculating this is modeling out every combination of wins and losses (by home and away games) for each series length.
Let’s look at a team with home ice advantage. The games that this team plays are set in stone. Let’s say their win probability for a particular matchup 60% at home, and 45% on the road. FYI, H = Home, A = Away, W = Win, L = Loss
4 games:
HHAA
The only way to win that series is by winning all 4 games.
WWWW
This is the simplest scenario of just multiplying the win percentages. 60%*60*45%*45% or 60%^2*45%^2 = ~7%.
However for 5 games it becomes a little more complicated.
5 games:
HHAAH
The loss could occur at home or away and that needs to be accounted for.
Home loss example:
LWWWW
40%*60%*45%*45%*60% = ~3%
Away loss example:
WWLWW
60%*60*55%*45%*60% = ~5%
Another thing that needs to be taken account is all possible games that a loss can occur for these two scenarios. For example, a loss at home can happen in the following three ways:
LWWWW
WLWWW
WWWWL
An away loss can occur in the following two scenarios
WWLWW
WWWLW
Therefore the way to calculate it is by taking one possible combination with a home loss and multiplying it by 3 and taking one possible combination with an away loss and multiplying it by 2, then adding them up.
In this situation it’s easy to calculate that there could be 3 different positions for a home loss and 2 for an away loss. But once it gets into 7 games it becomes more complicated. These are really combinations. In 3 home loss scenario we’re doing a combination of 1 win out of 3. The formula for a combination is:
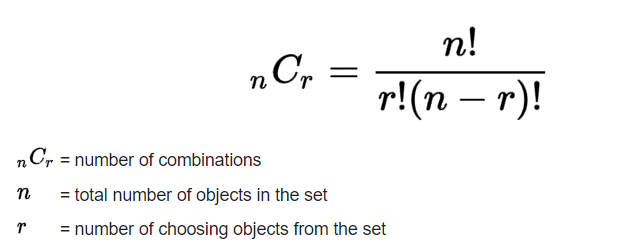
So 1 combination of 3 is 3C1 or 3!/(1!*2!). The “!” notation is referred to as factorial and is calculated in the following way: 3! = 3*2*1 = 6. So 3!/(1!*2!) = (3*2*1)/(1*2*1) which equals 3. 2C1 will equal 2. And you will notice that these are the two numbers already mentioned.
One note, there also something called the permutation that’s n!/(n-r)!, this is where order matters for the objects that you choose. Since losses are losses, combination is what’s relevant here.
One final step, someone with an eagle eye might have noticed that one possible scenario with a home loss is WWWWL. Anyone that knows the playoff format knows that’s impossible, as soon as a team wins 4 the series ends. However mathematically it’s possible. So this one probability needs to be taken out from the overall probability. One word of caution is not to just take out the probability of a sweep, because in 5 games the impossible probability isn’t WWWW (a sweep) it’s WWWWL. If as in this example the team has home ice this series a sweep multiplied by a home loss needs to be taken out of the total.
A similar process is repeated for the 6 game series where 3 different scenarios are possible (HL/HL, AL/AL, and AL/HL). It gets complicated for the scenario where there’s one home and one away loss. One combination needs to be multiplied by 3C1 and again by 3C1. There are 3 combinations of home losses AND away losses. Also, in the end the probability of a 5 game win followed by a loss needs to be taken out of the equation, as well as a probability of a 4 game win followed by two losses. The losses need to correspond where the games take place (home/away). 7 games is similar but the combinations get more tricky. In one scenario 2 home losses happen out of 4 (remember this is only for the team with home ice, the away team has this scenario for away losses). This is 4C2 or 4!/(2!*2!)=6.
That was the heavy lifting for the math. However, that’s only one round. Because each first round is set, that was the first round. For rounds 2 and 3, I mapped out all of the possible scenarios. There are 16 possible scenarios for round 2 and 4 scenarios for each of the 16 for a total of 64 in round 3. I used the same math to arrive at each possible scenario.
The final calculation was looking at all of the possible scenarios needed for the defending champ to advance through the rounds. In the second round it’s every scenario where the defending champ advances, their opponent advances, the defending champ wins their series and the two teams on the other side advance and each scenario in the other matchup happening (each team winning). For example in one scenario for the first round, if the defending champ is the 1 seed, the scenario where 1 plays 4 and 2 plays 3, the probability that 1 wins in the first round gets multiplied by the probability that 4 wins the 1st round and multiplied by 2 and 3 winning in the first round and 2 wins OR 3 wins (2 wins the matchup plus 3 wins the matchup). This calculation is done for each scenario and added. For round 3 a similar calculation is made using each of the 64 scenarios and the probability of each team getting there with the defending champ winning. In the cup final the actual cup finalist was used since the finalist comes from the other conference and no scenario in the defending champ’s conference impacts anything that happens in the other conference.
As previously mentioned the calculation was much simpler when the defending champ won rounds (in the real world). If they won one round (only the 09-10 Penguins did), the matchups were set in stone in the second round, and the probability of them winning the second round just becomes the probability of them winning that matchup. In the third round if the Penguins ended up winning their second round matchup they would have faced the 7th seeded Philadelphia Flyers, so the calculation only takes that scenario into consideration. Defending champs that lost in the conference final required the probability that they would have won their actual conference final matchup and the theoretical final matchup, and those that lost in the Stanley Cup final required just the probability of winning that final series. A note on the 06-07 Carolina Hurricanes and 14-15 Los Angeles Kings, they both missed the playoffs and were treated as 0% probability of winning the cup and were thus omitted from this analysis.
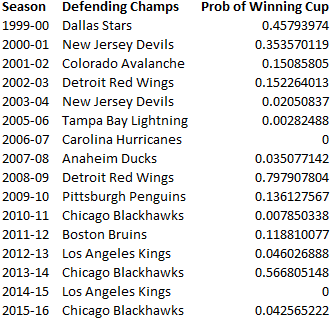
In the end, my final output was each defending champ’s probability of winning the cup. They range from the 2005-06 Tampa Bay Lightning (0.3%) that were an 8 seed and lost in the first round to the 08-09 Detroit Red Wings that made it to Stanley Cup final and were a 2 seed with a strong home regulation record (71% win percentage) playing a 4 seed with a weak away regulation away record (46% win percentage).
Sources:
