Hello again, it’s been a while. I came up with a relatively simple analysis that I think is pretty interesting.
DEFINITIONS
PP: Power Play, when the opposing team commits a penality and the team in question is at a man advantage with usually 5 players to the opposing team’s 4. Sometimes there’s a two man advantage (5 on 3). Usually the penalty is a minor, which means two minutes. If the team on the Power Play scores the penalty ends.
PK: Penalty Kill, the team at a man disadvantage during a penalty.
Minor penalty: Two minutes and if a goal is scored on the Power Play the penalty ends. Sometimes a double minor is assessed, which is four minutes and one goal can be scored on each minor.
Major penalty: Five minutes and a goal scored on the Power Play does not nulify the penalty.
SHG: Shorthanded goal, a goal scored by the team on the Penalty Kill. Currently in the NHL this does NOT nulify the penalty, but in the PWHL it does.
BACKGROUND
For some background there’s a new women’s hockey league called the PWHL or Professional Women’s Hockey League. There’s a rule that created a little bit of buzz in the league. If a team scores shorthanded it nulifies the Power Play. I excluded 5 on 3 Power Plays and majors because that would add significant complications to the analysis and both are very rare.
Many people claimed it would make the PK more aggressive resulting in both more goals shorthanded and Power Play goals against. Originally I thought that making the penalty kill more aggressive and opening up your team to more Power Play goals against just to score a few more shorthanded goals and nulify a few Power Plays was a ridiculous idea. After all teams score so much more on the Power Play than shorthanded. I assumed that it would be a net negative value-wise and no team would employ this strategy. However I decided to test my hypothesis and thus this project was born.
ANALYSIS
- A look at how at the break-even point of how much worse a PK can get in order to break-even in terms of goals given up and scored/saved.
- A look at whether this strategy would significantly increase scoring league-wide.
***All stats are from the 2022-23 season***
SCENARIOS
The following are the possible scenarios that may result from this analysis:
- Most teams would find it valuable to alter their PK strategy based on this rule.
- Most teams would NOT find it valuable to alter their PK strategy based on this rule.
- Somewhere in the middle. Around half of the teams would find altering strategy valuable.
In addition there would be scenarios associated with whether league scoring would increase if this rule were implemented. The following are the possible scenarios for this happening:
A) League scoring would increase significantly if all teams implemented a new PK strategy and even if only the teams that it was valuable for would implement it.
B) League scoring would increase significantly if all teams implemented a new PK strategy but NOT if only the teams that it was valuable for would implement it.
C) League scoring wouldn’t increase significantly even if all teams implemented the new strategy.
PART 1

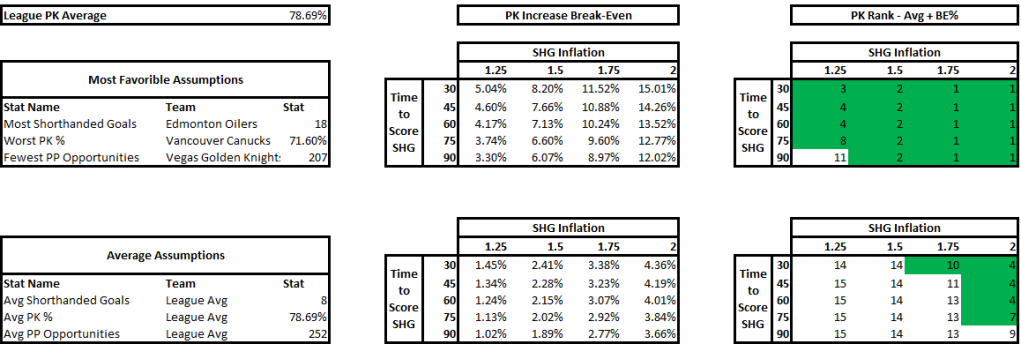
The above is part one of the analysis. The top half are the most favorable circumstances for this rule to provide positive value as its assumptions. I used the team with the most shorthanded goals last season in Edmonton which had 18. The more shorthanded goals they score, the more shorthanded goals the extra aggression will result in. Therefore adding value to the team. In addition I used the team with the worst PK in the league last season in Vancouver. The worse the PK the more goals being saved by nulifying the PP with the new rule. Finally, I used the team with the fewest Power Play opportunities in Vegas. The fewer Power Play opportunities the fewer Power Play goals given up due to the aggressive PK when not scoring a shorthanded goal.
The bottom half is the same as the top half but using average stats.
The Matrix on the left takes into account two variables as inputs: how much time it took to score the shorthanded goal on average and the shorthanded goal inflation, a multiple that will measure by how much the shorthanded goals increased due to the extra aggression. Time to score adjusts how likely that a Power Play goal would have been scored during a Power Play when a shorthanded goal was scored, if it hadn’t been scored. I made an assumption that probability to score is linear, a team is as likely to score in the 90th second as the 30th. For the purposes of this analysis a team that allows a shorthanded goal 30 seconds in on average that has an 80% PK (probability that a goal will be scored would be 20%) will have the effectiveness go down by a factor of 30/120 or 1/4 to ((100%-80%) * (1-1/4)) to 15%.
The outputs of the Matrix is PK % break-even point. This is by how much the PK % can go down for Power Plays where a shorthanded goal wasn’t scored to break-even (or be net zero). If the PK % goes down by less the team is net positive, if it’s more it’s net negative.
The calculation is as follows:
Value gained / Power Play opportunities where no shorthanded goal was scored
Value gained is measured by additional goals scored by being aggressive (current shorthanded goals * (SHG inflation multiple – 1)) and the hypothetical goals avoided by the nulification of the Power Play. This calculation takes into account the PK %, shorthanded goals scored (including the SHG inflation multiple) as the opportunities and how much time it takes a team to score shorthanded on average.
PP opportunities where no shorthanded goal was scored is simply PP opportunities minus shorthanded goals multipled by the SHG inflation multiple.
Finally, the matrixes on the right put these break-even PK % in perspective. I added that percentage to the average PK % in the league and measured where it would rank. I treated 10th or higher (colored green) as a significant PK % change. If it was 10th or higher that means that the break-even point is significantly high and therefore the PWHL PK rule would more than likely provide positive value.
My finding was that if your team has the most favorable circumstances this rule change provides value, but unless you expect your team’s shorthanded goal scoring to increase significantly, the average team has no value in this rule.
PART 2

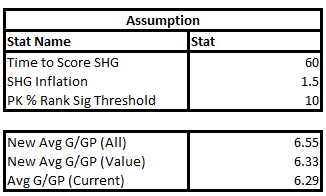
For part 2, I wanted to see if scoring would increase league-wide if this rule were implemented. I applied the above assumptions. 60 seconds to score a shorthanded goal and a 1.5 bump were average assumptions from the previous exercise and the PK % rank significance threshold means that the PK % would decrease by the amount that would bring the average PK % up to #10 overall, if added to it. This was the lowest threshold of what I’d consider significant.
I assigned two metrics to each team in the NHL.
- The value gained or lost by this rule. That’s the previously discussed value of additional shorthanded goals scored + PP goals saved – additional PP goals allowed.
- I assigned a number for how many additional goals would be added to a team’s games. This is additional shorthanded goals scored + PP goals allowed – PP goals saved.
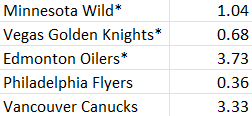
I discovered that only 5 teams have a positive value in being more aggressive given the above assumptions.

The drivers were PK (poorer was higher value) and shorthanded goals (more was higher value). Four of the five teams were in the bottom half of the NHL in PK (Minnesota was 10th), the rest ranged from 19 – 32. All of these teams scored 10 or more shorthanded goals (8 was the average per team).
The bottom number in the bottom table of the screenshot is the average goals in a given game in the NHL last season. The top number is if all the teams bought into the strategy of being more aggressive. The middle number is if only the five teams identified above implemented the strategy. If only the teams that it was worth it for employed the strategy, the bump in scoring would be minimal (~0.04). However, if all teams did it was a little more significant but not as significant as one would think (~0.26).
There was a significantly bigger bump in just one year between 20-21 and 21-22, this bump would be about equivalent to0. the difference between the high scoring 05-06 season and 22-23. So not insignificant but not drastic either.
My analysis is that given these assumptions (SHG inflation is by far the most significant because it adds value to teams and directly impacts scoring), if there’s universal buy in the rule might make a significant but not drastic difference. However, if coaches whose teams it’s not advantageous for don’t buy in it’ll make no significant difference. These are scenarios B and 2 listed in the scenarios section.
I posit that only a few coaches would have a more aggressive PK because for most teams it wouldn’t be advantageous and as a result the league-wide scoring won’t increase by a whole lot.
Sources:
https://www.hockey-reference.com/leagues/NHL_2023.html#all_stats